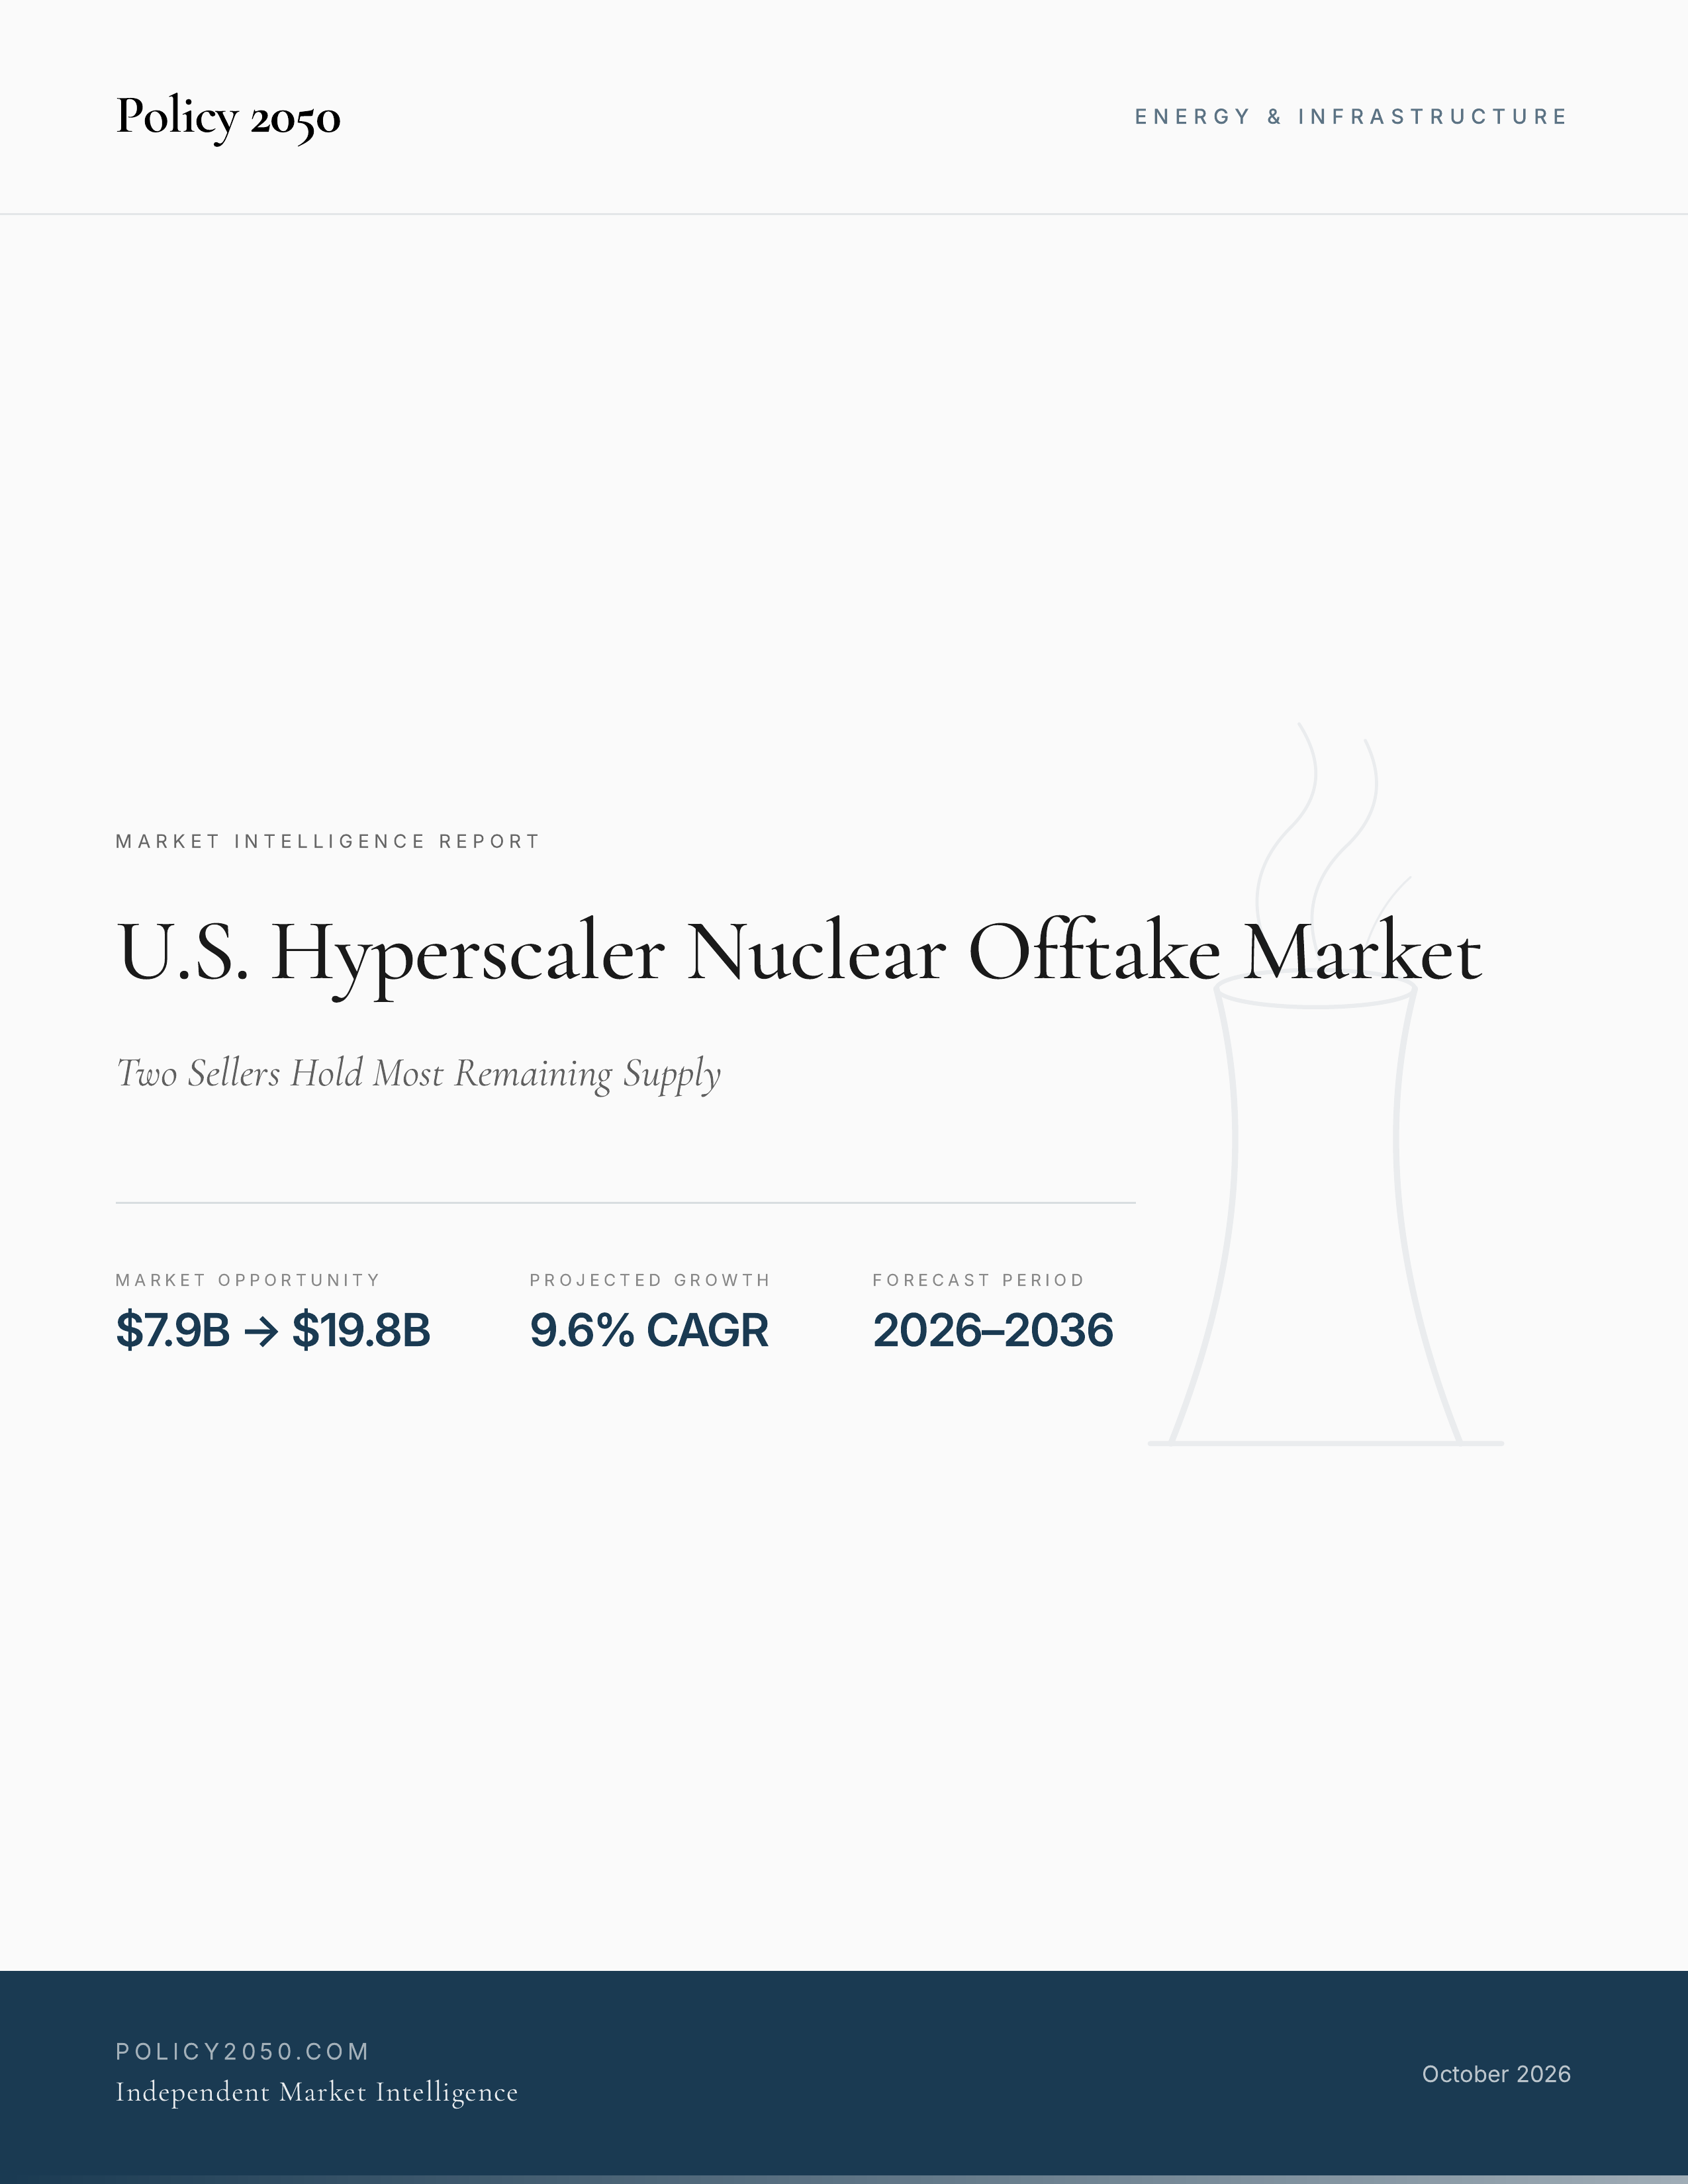
Hyperscalers have signed about $7.9 billion a year of U.S. nuclear power, the base case projects $19.8 billion by 2036 at a 9.6% nominal CAGR, and two sellers hold roughly four-fifths of what the four largest merchant nuclear owners have left to sell.
Amazon signed a 20-year Calvert Cliffs agreement with Constellation Energy on September 30, 2026, and Google signed 890 MW uprate and 2,700 MW supply deals with the same seller on October 6. These deals lift hyperscaler nuclear offtake in the United States to about $7.9 billion a year of signed contracts, valued at full ramp in 2026 dollars, not as 2026 delivered revenue.
Saleable supply caps the market, and the pace of signing sets growth beneath that cap. Roughly four-fifths of what remains saleable among the four largest merchant nuclear owners sits with Constellation Energy and PSEG. The base case projects growth from $7.9 billion in 2026 to $19.8 billion by 2036, a 9.6% CAGR in nominal terms, with conservative and optimistic scenarios around it.
Contract structure, not the plant, sets the price, with a spread of up to $45/MWh between attribute-only contracts and a contract that funds a restart.
The 80-page report sizes the market by contract structure, buyer and seller, maps the 10 signed contracts totalling 12.4 GW, and nets each seller’s uncontracted output from its own SEC filings. It profiles 10 companies, including Vistra, Talen Energy, NextEra Energy, Amazon, Google, Meta and Microsoft, and includes 16 charts and figures, 12 data tables and a 2026–2036 forecast with three scenarios.
Report Highlights:
- Saleable Supply Caps the Market: Most of the saleable uncontracted output held by the four largest merchant nuclear owners sits with Constellation Energy and PSEG, so whoever signs next will mostly be buying from two companies. The report measures each seller’s contracted and saleable output from its own filings.
- Signed Value, Not Delivered Revenue: About $7.9 billion a year of hyperscaler nuclear offtake is already under contract across 10 deals and 12.4 GW, valued at full ramp in 2026 dollars. The base case projects $19.8 billion by 2036, a 9.6% nominal CAGR of which about 2 points reflect an assumed 2% annual escalator.
- Five Contract-Structure Segments: Physical front-of-meter supply is the largest of five contract-structure segments, and uprate-funding PPAs grow fastest in the base case, because almost every realistic restart candidate has already been contracted. The report sizes each segment for 2026 and forecasts it to 2036.
- Price Benchmarks by Contract Structure: Contract structure, not the plant, sets the price, with a spread of up to $45/MWh between attribute-only contracts and a contract that funds a restart. Physical supply is priced beneath the sellers’ reported figures, which the report treats as ceilings.
- The Signed Deal Ledger: The report maps the 10 hyperscaler contracts signed with U.S. nuclear owners since September 2024 and attributes signed value to each seller and buyer.
- Policy and Measurement Risk: The main policy risk is ratepayer politics: the House passed the Ratepayer Protection Act 417–3, but the Senate blocked it 57–43 in September 2026. The main measurement risk is price: no hyperscaler nuclear contract discloses one.
This report will provide answers to the following questions:
- How large is the U.S. hyperscaler nuclear offtake market in 2026, measured as the annual value of contracts already signed?
- How fast will the market grow to 2036 in the base case, and what do the conservative and optimistic scenarios show?
- How much nuclear output do the four largest merchant nuclear owners have left to sell, and who holds it?
- How do prices differ across physical supply, financial supply, virtual PPAs, and restart and uprate-funding contracts?
- Which contract structures, buyers and sellers account for the signed value?
- What role will uprates, licence renewals and restarts play in new supply?
- How could ratepayer politics, additionality and price opacity constrain the market?
Companies Covered:
Constellation Energy, Vistra, Talen Energy, PSEG, NextEra Energy, Southern Company (Georgia Power), Amazon (AWS), Google (Alphabet), Meta, Microsoft
Report Specifications:
80 pages · 16 charts and figures · 12 data tables · 10 company profiles · 10-year forecast horizon to 2036 · 3 scenarios · 3 segmentation views
Pricing:
- Single User License – $9,950
- Site License – $10,950
- Enterprise License – $11,950
To place an order, contact david.pringmill@policy2050.com